
III. How much Energy is Needed?
Senate Bill 100 (2018) requires 100 percent of California’s electric retail sales be supplied by renewable and zero-carbon energy sources by 2045. SB 1020 (2022), established interim targets of 90 percent clean electricity by 2035 and 95 percent by 2040. The challenge is to meet these goals.
Unfortunately, the current rate of installation of new renewable energy generation sources is well below the state’s required pace.
Table 1 (source – California Energy Commission) shows that the state is not on track to meet its targets. The Table shows that the state produced 203 TWH of electricity in 2022 of which 83 TWH (83,153 gWh, about 41%) was zero-carbon.
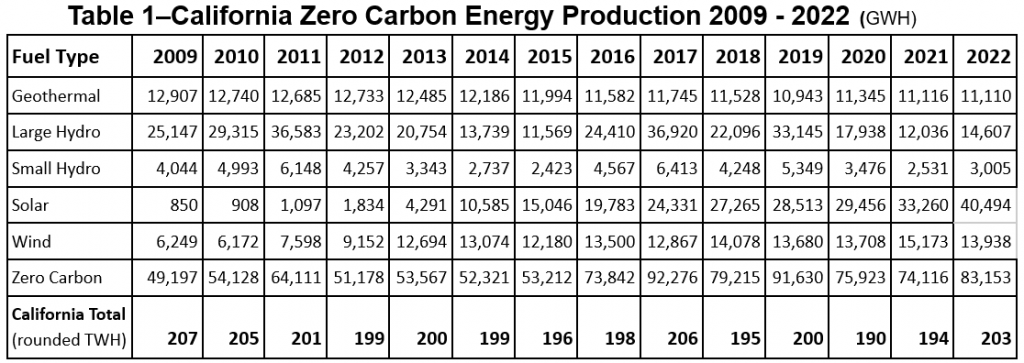
Table 1 shows that zero carbon energy produced in California rose from 49 TWH in 2009 to 83 TWH in 2022. At this rate–2.4 TWH increase per year–California would reach about 140 TWH by 2040, which would only be 70% of the state’s current energy total. This slow rate of increase is shown in Figure 1.
Figure 1
But the reality is even more challenging than the current figures suggest. With the growth in EVs and building electrification, total energy needed in California will grow substantially, which means that energy production will need to increase faster just to keep up. We will discuss this in detail below.
Looking at California’s total energy picture–including imports (source)–the numbers in Table 2 show that 43% of California’s total energy of 287 TWH was zero carbon in 2022. The state imported 84 TWH of electricity1 of which 40 TWH was zero carbon2.
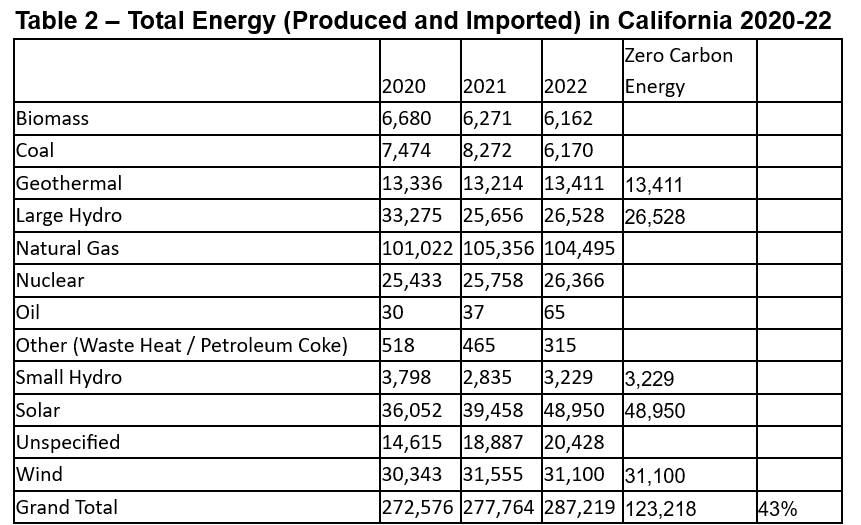
1 Computed from Table 2 – Table 1: 287 TWH – 203 TWH = 84 TWH
2 Computed using Table 2–123 TWH total zero carbon – total minus Table 1–83 TWH CA zero carbon
These tables do not include rooftop solar, which produced 23 TWH in 2022 according to Wikipedia. This could lead us to a long discussion about why rooftop solar is not incorporated more closely into the State’s energy planning, but this is beyond the scope of this paper. I am working on a separate paper to discuss the attacks on rooftop solar, and why we need to combat them.
How much additional clean energy do we need?
As noted, an important factor is the growth of EVs (cars, trucks & buses) and heat pumps. My calculation estimates about a 90% growth by 2045. This is very close to the San Diego Gas & Electric estimate of 96% growth. The California Independent Service Operators, (CAISO) estimates that “the amount of electricity projected to be needed two decades from now is almost three times what the grid has today.” CAISO doesn’t say how they got that number, so I’m inclined to think it’s too high. But I will round my number up to estimate that we will need 2.0 times the current energy by 2045, i.e. 100% growth.
Based on this, the state will need 287 TWH (from Table 2) x 2.0 = 574 TWH by 2045. If we maintain the same percentage of imports (29%), then 574 x .29 = 167 TWH would be imported and 407 TWH would be produced in California. The state currently produces 83 TWH of zero carbon electricity, and would need to expand this to 407 TWH, an increase of 324 TWH, or a factor of almost 5, with a similar increase for imported clean electricity.
This added energy will have to be mostly from wind and solar backed by storage since it is unlikely that geothermal or hydro (large or small) will increase significantly.
To sum up, to achieve 100% clean energy by 2045 California need to:
- Continue to produce 83 TWH with water, wind, sun, and geothermal
- Replace the remainder of the 203 TWH non-zero carbon energy that we currently produce with wind and solar–203 – 83 = 120 TWH
- Double the amount of clean electricity, i.e. add 203 TWH
Total clean energy needed = 83 + 120 + 203 = 407 TWH (rounded)
These numbers all point to the need to accelerate installation of wind and solar as rapidly as possible. At the growth rate shown in Figure 1 we would only reach 141 TWH by 2045–i.e. way below 407 TWH needed!
To understand how much power we need to add to generate this much energy, we need to look at the Power side of the picture.
IV. How much Power is Needed?
Since Energy = Power x Time, then Power = Energy divided by Time. So if we know how much energy we need in a year, we can divide that by the number of hours in a year to convert to power needed.
When we divide 407 TWH by 8760 hours per year, we get 46 GW of power on average will be needed.
But it’s not quite that simple.
There are at least two issues that complicate the power picture–the capacity factor and the peak hour problem.
Capacity Factor
We can’t count on the power actually supplied to the grid to be at 100% of capacity. This means that we need to provide more power capacity to meet actual power demands. How much more capacity do we need?
Wind and solar are intermittent sources. Figure 2 below (Source) shows their capacity factor–defined as the % of capacity that they actually produce compared to their theoretical capacity–to be about 30%.
Figure 2
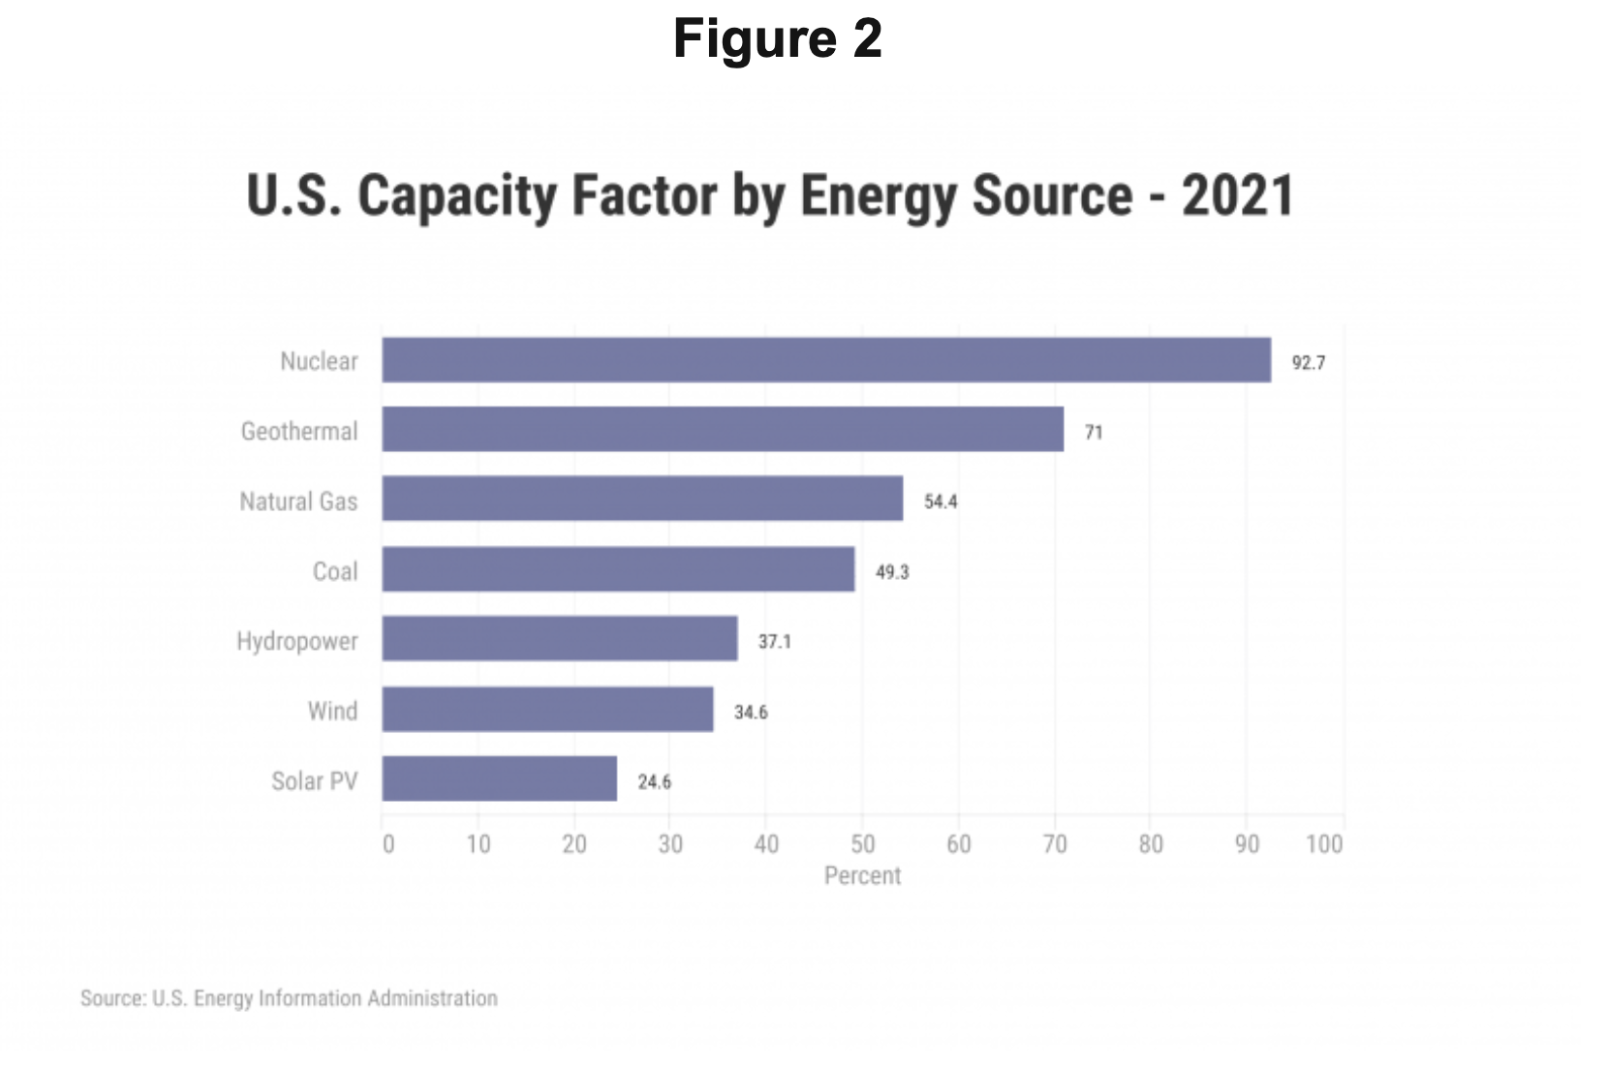
This means that to generate a total of 46 GW of power, we need 46 GW divided by .30 = 153 GW of capacity. We should also add 10% for power losses in transmission. This gives us about 168 GW of capacity needed.
Figure 3 from May 2023’s Building The Electricity Grid Of The Future: California’s Clean Energy Transition Plan suggests that California needs to reach 183,000 MW (183 GW) by 2045.
Figure 3
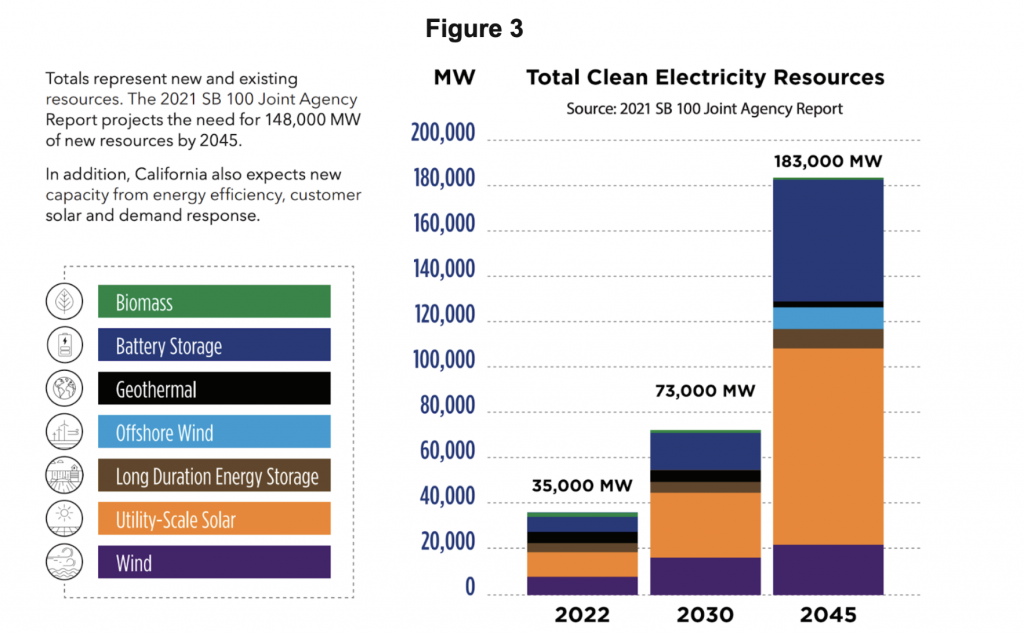
Note that Figure 3 counts storage as a source of energy. Most of this is short term–4 hours of power per day. To create the storage requires added wind or solar, so the total of 183 GW projected in Figure 3 is not too far from my estimate of 168 GW needed.
These numbers now give us the ability to understand what is meant by the statement, “California will add 20GW of offshore wind by 2040.” Offshore wind is represented by the light blue portion of the 2045 graph in Figure 3. We can understand that 20GW of offshore wind power would be a valuable, but still small part of the overall power needed.
We still don’t know how much energy the 20 GW will generate without knowing the capacity factor. This article from the National Renewable Energy Labs puts the capacity factor for offshore wind around 45%. So we can calculate 20 GW x 8760 hours x .45 = 79 TWH. We estimated above that California will need to produce 407 TWH, so offshore wind could provide 19% of the total–not bad! Unfortunately there are lots of technical issues with developing offshore wind, so achieving California’s goal is not a simple matter.
The Peak Hour Problem
Not only do we need to adjust power for the capacity factor, but we also can’t count on the grid’s power demand to be constant, i.e. we have to plan for the peak periods.
This problem is known as the “duck curve” as shown in Figure 4 below (source):
Figure 4–The Duck Curve in California
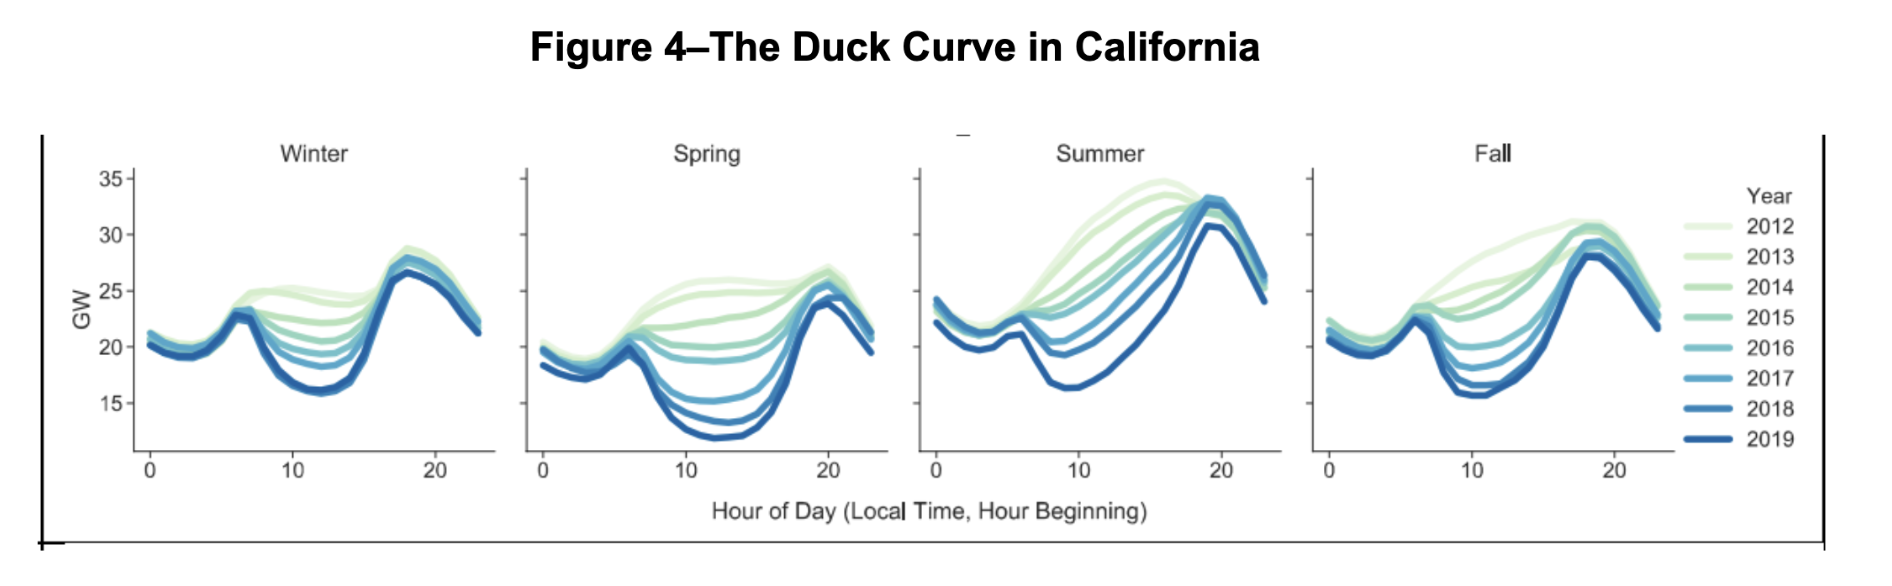
The curves in Figure 4 show that, as solar power production has increased in the years 2012- 2019, the demand for power from other sources during the day has dropped. This creates a PM peak of power demand (the head of the duck), especially in the summer, but persistently throughout the year. The problem is that the grid needs to be built to meet that peak demand to avoid power blackouts. It also needs to supply power at night as well as the day. As shown in the figures, the power demand on the grid normally doesn’t go above 30 – 35 GW, so it would seem that a grid with 35 GW of power would be sufficient. But for a few hours a year the demand can shoot up to over 50 GW.
This means that power sources may need to provide around 15 GW above the average load to make sure there are no power shortages. Clearly this is an expensive added cost.
The utilities have built methane gas “peaker plants” to address the peak hour problem. California has peaker plants that can produce about 16 GW of power when needed.
There are several alternate ways to solve the peak hour problem. One is to shift the demand from the PM peak to the daytime by Time-of-Use (TOU) electricity rates. Related to this are Demand Response programs to further incentivize customers to reduce use in the PM peak. The state legislature has set a goal of 7 GW of Demand Response. 350 Bay Area is proposing a bill that would codify the legislature’s call for Demand Response and increase the target to 15 GW.
Another approach is to encourage battery storage so that excess solar built up during the day can be used for the PM peak. If the batteries are “Long Duration”–e.g. 10 hours or so, they can also serve overnight power demands.
California now has over 6 GW of battery storage–up from less than 1 GW in 2020– plus about 10 GW of hydro storage that can be used in peak periods. Figure 5 below shows the rapid growth of batteries.
Figure 5–Growth of Batteries in California
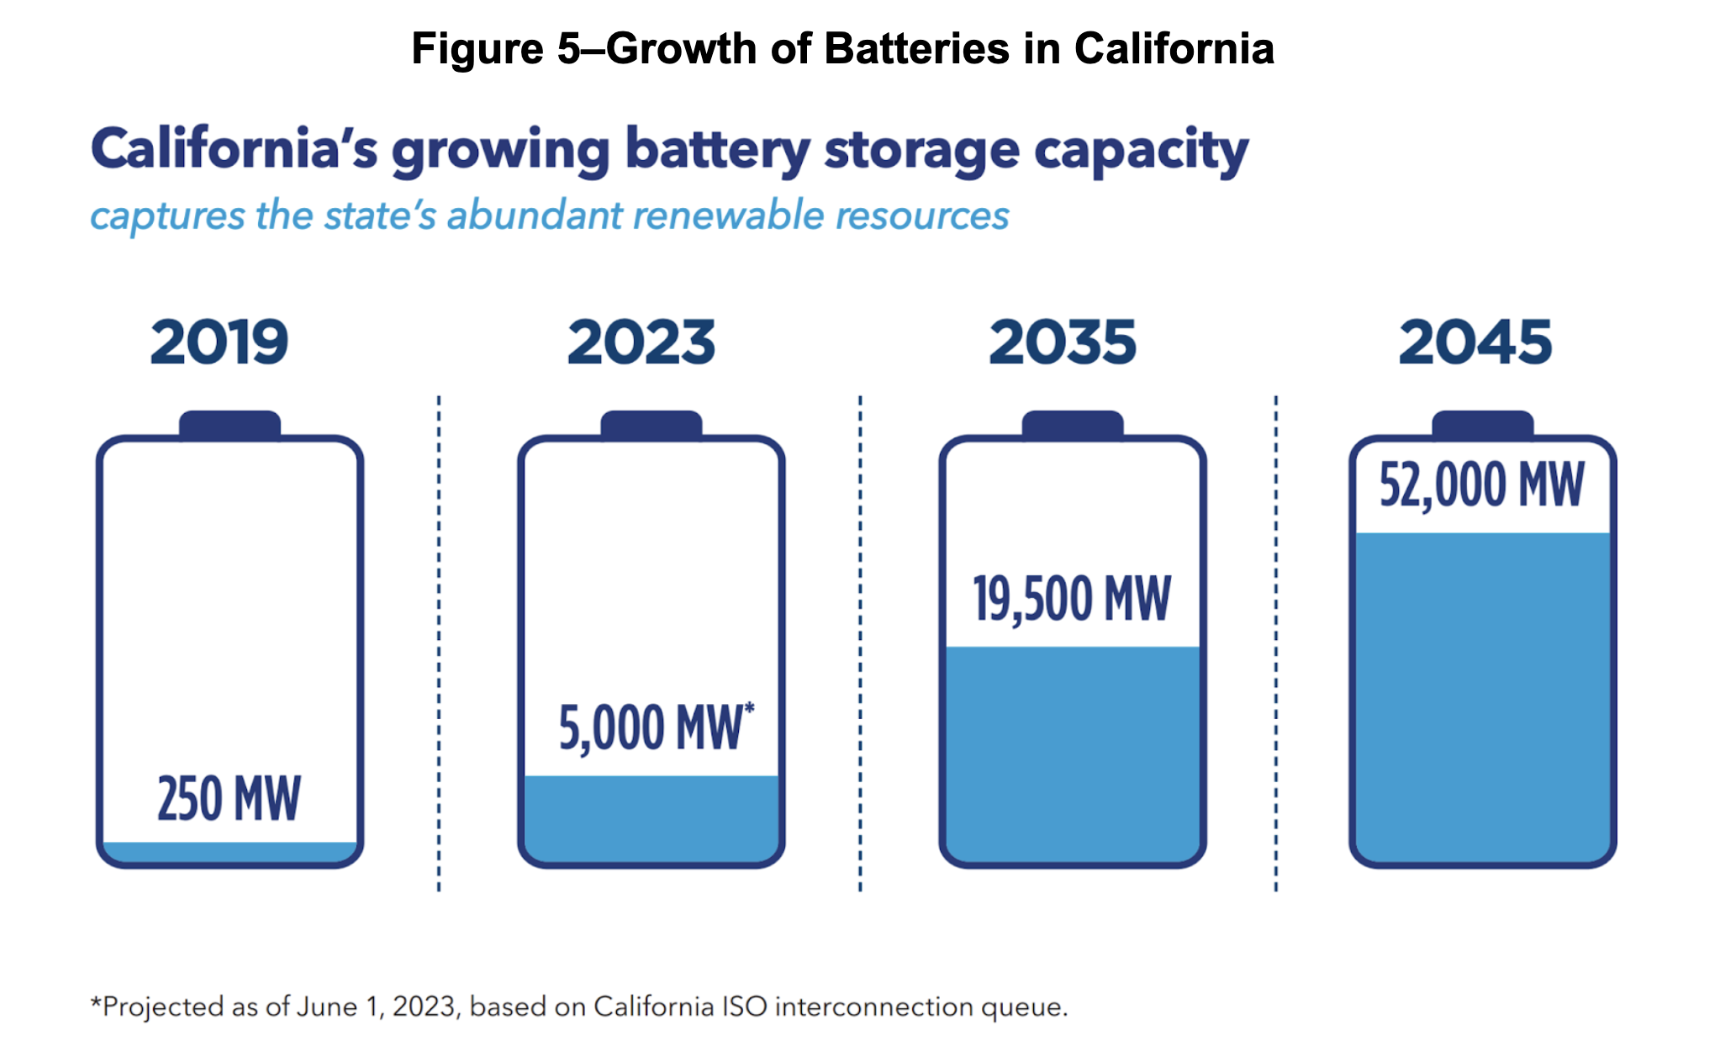
As noted, this storage is designed only for about 4 hours, aiming to flatten the PM peak; this gives it a capacity factor of 4/24 = .16. This means that 52,000 MW of storage can provide about only about 7 TWH of energy. (52 GW x 8760 hours x .16) In other words, a lot more storage will be needed to replace all the methane gas plants, which provide energy overnight.
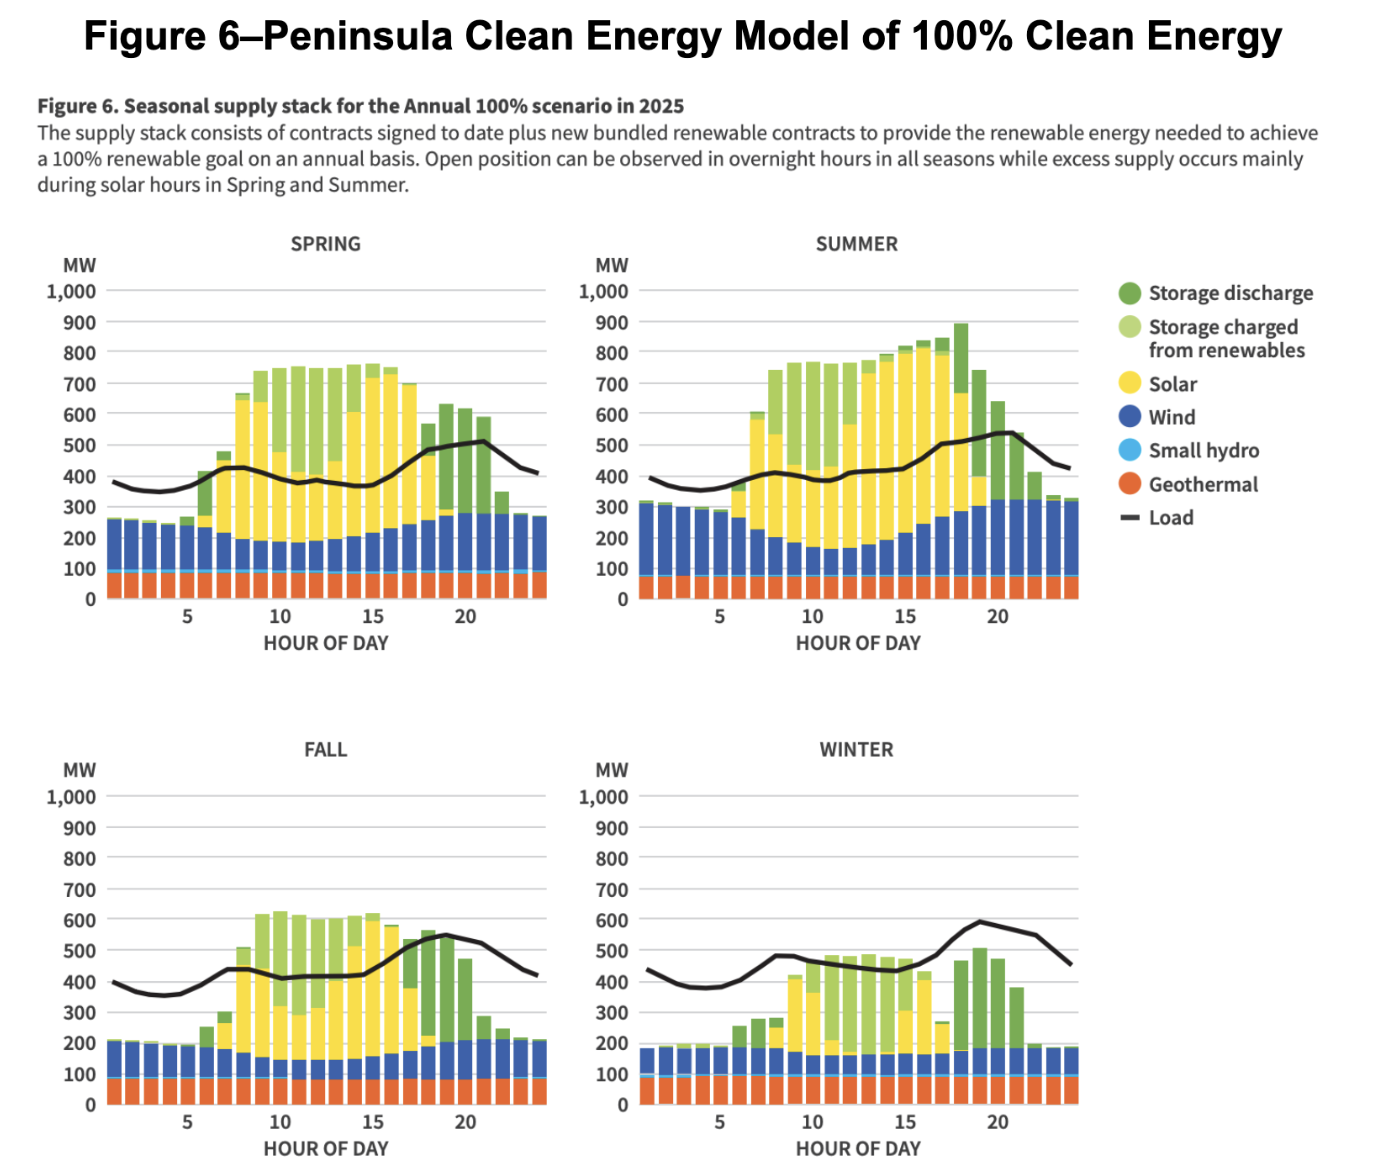
This is further illustrated in Figure 6 from Peninsula Clean Energy (PCE), which shows how achieving 100% annual renewable energy–i.e. the total renewable energy generated equals the total demand—still leaves gaps at night, especially in the fall and winter, when additional power is needed. (source)
The PCE report also says, “Seasonal storage could help to reduce excess supply, but no cost-effective seasonal storage is yet available.” This is illustrated in Figure 6, which shows a big excess of energy in the summer, and a shortfall in the winter. If we add more solar, we end up with even more excess in the summer. This is where offshore wind could be very valuable, since the wind is strong at night, and year round. It’s also possible that clean hydrogen, made from water, could be stored from summer to winter.1
Figure 6–Peninsula Clean Energy Model of 100% Clean Energy
1 Note that PCE’s 100% annual clean energy, while not ideal, still emits about 50% fewer GHGs than the state average–101 g/kWh for PCE vs. 207 g/kWh state average, and about 75% below the US average of 390 g/KWH. And PCE is aiming for 24/7 clean energy–see their report for details.
The California Energy Commission predicts that peak power needs will grow from 62 to 75 GW in 2035 (see tab Form 1.4–”Final Net Peak”, high use scenario). This is a power, can deliver about 45GW, not counting peaker plants; it it grows toward the 168 GW that I’m estimating it will need in 2045, it will add about 5 GW per year of new wind and solar. If this is combined with storage, including vehicle to grid, and demand management, the peak hour should be more than covered in future years.
However, as argued, while achieving 168 GW would mean that we won’t require peaker plants to meet short periods of peak demand, we would still need some existing methane gas plants unless solar, wind, and storage can be increased, and/or if summer surpluses of solar can be stored as hydrogen or some long term storage for the dark winter months.